
希金斯維爾 (密蘇里州):修订间差异
删除的内容 添加的内容
新條目 |
小 // Edit via Wikiplus 标签:HTML註解 |
||
| 第6行: | 第6行: | ||
{{Infobox settlement |
{{Infobox settlement |
||
|name = 希金斯維爾 |
|name = 希金斯維爾 |
||
|native_name = |
|native_name = |
||
|settlement_type = [[城市]] |
|settlement_type = [[城市]] |
||
|image_skyline = Higginsville.jpg |
|image_skyline = Higginsville.jpg |
||
| 第47行: | 第47行: | ||
|area_code = {{link-en|电话区号660|Area code 660|660}} |
|area_code = {{link-en|电话区号660|Area code 660|660}} |
||
|blank_name = [[地名信息系统|GNIS ID]] |
|blank_name = [[地名信息系统|GNIS ID]] |
||
|blank_info = 2394373<ref name="GNIS">{{cite gnis|2394373| |
|blank_info = 2394373<ref name="GNIS">{{cite gnis|2394373|}}</ref> |
||
}} |
|||
'''希金斯維爾'''({{lang-en|Higginsville}})是位於[[美國]][[密蘇里州]][[拉法葉縣 (密蘇里州)|拉法葉縣]]的[[城市]]。 |
|||
{{Weather box <!-- Infobox begins --> |
|||
| single line = Y |
|||
| location = 希金斯維爾 (密蘇里州),1991–2020年正常值,1991年至今極端數據 |
|||
|Jan record high F = 72 |
|||
|Feb record high F = 75 |
|||
|Mar record high F = 81 |
|||
|Apr record high F = 89 |
|||
|May record high F = 93 |
|||
|Jun record high F = 102 |
|||
|Jul record high F = 103 |
|||
|Aug record high F = 106 |
|||
|Sep record high F = 104 |
|||
|Oct record high F = 93 |
|||
|Nov record high F = 80 |
|||
|Dec record high F = 73 |
|||
|Jan avg record high F = 62.5 |
|||
|Feb avg record high F = 65.5 |
|||
|Mar avg record high F = 76.1 |
|||
|Apr avg record high F = 82.5 |
|||
|May avg record high F = 87.7 |
|||
|Jun avg record high F = 93.4 |
|||
|Jul avg record high F = 95.4 |
|||
|Aug avg record high F = 96.2 |
|||
|Sep avg record high F = 91.7 |
|||
|Oct avg record high F = 85.1 |
|||
|Nov avg record high F = 72.9 |
|||
|Dec avg record high F = 63.5 |
|||
|year avg record high F = 98.1 |
|||
<!-- Average high temperatures --> |
|||
| Jan high F =36.4 |
|||
| Feb high F =41.6 |
|||
| Mar high F =53.1 |
|||
| Apr high F =63.6 |
|||
| May high F =73.6 |
|||
| Jun high F =82.8 |
|||
| Jul high F =86.7 |
|||
| Aug high F =85.5 |
|||
| Sep high F =78.5 |
|||
| Oct high F =66.5 |
|||
| Nov high F =52.3 |
|||
| Dec high F =40.6 |
|||
<!-- Mean daily temperature --> |
|||
| Jan mean F =27.4 |
|||
| Feb mean F =32.0 |
|||
| Mar mean F =42.8 |
|||
| Apr mean F =53.3 |
|||
| May mean F =64.1 |
|||
| Jun mean F =73.3 |
|||
| Jul mean F =77.1 |
|||
| Aug mean F =75.4 |
|||
| Sep mean F =67.5 |
|||
| Oct mean F =55.5 |
|||
| Nov mean F =42.7 |
|||
| Dec mean F =32.0 |
|||
<!-- Average low temperatures --> |
|||
| Jan low F =18.4 |
|||
| Feb low F =22.5 |
|||
| Mar low F =32.5 |
|||
| Apr low F =43.1 |
|||
| May low F =54.5 |
|||
| Jun low F =63.9 |
|||
| Jul low F =67.6 |
|||
| Aug low F =65.3 |
|||
| Sep low F =56.5 |
|||
| Oct low F =44.5 |
|||
| Nov low F =33.2 |
|||
| Dec low F =23.4 |
|||
|Jan avg record low F = -1.5 |
|||
|Feb avg record low F = 1.9 |
|||
|Mar avg record low F = 14.1 |
|||
|Apr avg record low F = 28.5 |
|||
|May avg record low F = 40.9 |
|||
|Jun avg record low F = 53.5 |
|||
|Jul avg record low F = 59.3 |
|||
|Aug avg record low F = 55.1 |
|||
|Sep avg record low F = 43.5 |
|||
|Oct avg record low F = 28.5 |
|||
|Nov avg record low F = 16.4 |
|||
|Dec avg record low F = 5.3 |
|||
|year avg record low F = -4.8 |
|||
|Jan record low F = -13 |
|||
|Feb record low F = -13 |
|||
|Mar record low F = -7 |
|||
|Apr record low F = 17 |
|||
|May record low F = 31 |
|||
|Jun record low F = 45 |
|||
|Jul record low F = 52 |
|||
|Aug record low F = 49 |
|||
|Sep record low F = 32 |
|||
|Oct record low F = 21 |
|||
|Nov record low F = -2 |
|||
|Dec record low F = -9 |
|||
<!-- Total precipitation, this should include rain and snow. --> |
|||
| precipitation colour = green |
|||
| Jan precipitation inch =1.37 |
|||
| Feb precipitation inch =1.77 |
|||
| Mar precipitation inch =2.84 |
|||
| Apr precipitation inch =4.24 |
|||
| May precipitation inch =5.30 |
|||
| Jun precipitation inch =4.88 |
|||
| Jul precipitation inch =5.04 |
|||
| Aug precipitation inch =3.94 |
|||
| Sep precipitation inch =4.04 |
|||
| Oct precipitation inch =3.16 |
|||
| Nov precipitation inch =2.46 |
|||
| Dec precipitation inch =1.83 |
|||
|unit precipitation days = 0.01 in |
|||
|Jan precipitation days = 7.3 |
|||
|Feb precipitation days = 6.9 |
|||
|Mar precipitation days = 10.0 |
|||
|Apr precipitation days = 10.9 |
|||
|May precipitation days = 12.0 |
|||
|Jun precipitation days = 10.1 |
|||
|Jul precipitation days = 9.2 |
|||
|Aug precipitation days = 9.1 |
|||
|Sep precipitation days = 8.3 |
|||
|Oct precipitation days = 9.1 |
|||
|Nov precipitation days = 7.2 |
|||
|Dec precipitation days = 7.5 |
|||
<!-- Snowfall --> |
|||
| Jan snow inch =4.8 |
|||
| Feb snow inch =3.1 |
|||
| Mar snow inch =1.4 |
|||
| Apr snow inch =0.2 |
|||
| May snow inch =0.0 |
|||
| Jun snow inch =0.0 |
|||
| Jul snow inch =0.0 |
|||
| Aug snow inch =0.0 |
|||
| Sep snow inch =0.0 |
|||
| Oct snow inch =0.2 |
|||
| Nov snow inch =1.0 |
|||
| Dec snow inch =3.0 |
|||
|unit snow days = 0.1 in |
|||
|Jan snow days = 2.8 |
|||
|Feb snow days = 1.9 |
|||
|Mar snow days = 0.9 |
|||
|Apr snow days = 0.2 |
|||
|May snow days = 0.0 |
|||
|Jun snow days = 0.0 |
|||
|Jul snow days = 0.0 |
|||
|Aug snow days = 0.0 |
|||
|Sep snow days = 0.0 |
|||
|Oct snow days = 0.2 |
|||
|Nov snow days = 0.4 |
|||
|Dec snow days = 2.1 |
|||
|source 1 = [[美国国家海洋和大气管理局|NOAA]]<ref name = NOAA> |
|||
{{cite web |
|||
|url = https://www.ncei.noaa.gov/access/services/data/v1?dataset=normals-monthly-1991-2020&stations=USC00233838&format=pdf&dataTypes=MLY-TMAX-NORMAL,MLY-TMIN-NORMAL,MLY-TAVG-NORMAL,MLY-PRCP-NORMAL,MLY-SNOW-NORMAL |
|||
|publisher = National Oceanic and Atmospheric Administration |
|||
|title = U.S. Climate Normals Quick Access – Station: Higginsville, MO |
|||
|access-date = 2023-03-05 |
|||
}} |
|||
</ref> |
|||
|source 2 = National Weather Service (mean maxima/minima 2006–2020)<ref name = NOWData> |
|||
{{cite web |
|||
|url = https://www.weather.gov/wrh/climate?wfo=eax |
|||
|publisher = National Weather Service |
|||
|title = NOAA Online Weather Data – NWS Pleasant Hill |
|||
|access-date = 2023-03-05 |
|||
}} |
|||
</ref> |
|||
}} |
}} |
||
'''希金斯維爾'''({{lang-en|Higginsvillw}})是位於[[美國]][[密蘇里州]][[拉法葉縣 (密蘇里州)|拉法葉縣]]的[[城市]]。 |
|||
== 人口 == |
== 人口 == |
||
| 第57行: | 第230行: | ||
{{reflist}} |
{{reflist}} |
||
{{拉法葉縣 (密蘇里州)}} |
{{拉法葉縣 (密蘇里州)}} |
||
{{DEFAULTSORT: |
{{DEFAULTSORT:, Missouri}} |
||
[[Category:密蘇里州城市]] |
[[Category:密蘇里州城市]] |
||
[[Category:拉法葉縣城市 (密蘇里州)]] |
[[Category:拉法葉縣城市 (密蘇里州)]] |
||
2024年5月23日 (四) 04:36的版本
| 希金斯維爾 Higginsville | |
|---|---|
| 城市 | |
 | |
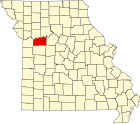
 希金斯維爾在拉法葉縣及密蘇里州的位置(以紅色標示) | |
 希金斯維爾 希金斯維爾在密蘇里州的位置 | |
| 坐标:39°03′55″N 93°44′37″W / 39.06528°N 93.74361°W | |
| 國家 | 美国 |
| 州份 | 密蘇里州 |
| 縣 | 拉法葉縣 |
| 面积 | |
| • 总计 | 9.84 平方公里(3.80 平方英里) |
| • 陸地 | 9.76 平方公里(3.77 平方英里) |
| • 水域 | 0.08 平方公里(0.03 平方英里) |
| 海拔 | 262 公尺(860 英尺) |
| 人口(2020)[1] | |
| • 總計 | 4,817人 |
| • 密度 | 490人/平方公里(1,268人/平方英里) |
| 时区 | CST(UTC-6) |
| • 夏时制 | CDT(UTC-5) |
| 郵區編號 | 64037 |
| 電話區號 | 660 |
| GNIS ID | 2394373[2] |
希金斯維爾(英語:Higginsville)是位於美國密蘇里州拉法葉縣的城市。
| 希金斯維爾 (密蘇里州),1991–2020年正常值,1991年至今極端數據 | |||||||||||||
|---|---|---|---|---|---|---|---|---|---|---|---|---|---|
| 月份 | 1月 | 2月 | 3月 | 4月 | 5月 | 6月 | 7月 | 8月 | 9月 | 10月 | 11月 | 12月 | 全年 |
| 历史最高温 °F(°C) | 72 (22) |
75 (24) |
81 (27) |
89 (32) |
93 (34) |
102 (39) |
103 (39) |
106 (41) |
104 (40) |
93 (34) |
80 (27) |
73 (23) |
106 (41) |
| 平均最高温 °F(°C) | 62.5 (16.9) |
65.5 (18.6) |
76.1 (24.5) |
82.5 (28.1) |
87.7 (30.9) |
93.4 (34.1) |
95.4 (35.2) |
96.2 (35.7) |
91.7 (33.2) |
85.1 (29.5) |
72.9 (22.7) |
63.5 (17.5) |
98.1 (36.7) |
| 平均高温 °F(°C) | 36.4 (2.4) |
41.6 (5.3) |
53.1 (11.7) |
63.6 (17.6) |
73.6 (23.1) |
82.8 (28.2) |
86.7 (30.4) |
85.5 (29.7) |
78.5 (25.8) |
66.5 (19.2) |
52.3 (11.3) |
40.6 (4.8) |
63.4 (17.5) |
| 日均气温 °F(°C) | 27.4 (−2.6) |
32.0 (0.0) |
42.8 (6.0) |
53.3 (11.8) |
64.1 (17.8) |
73.3 (22.9) |
77.1 (25.1) |
75.4 (24.1) |
67.5 (19.7) |
55.5 (13.1) |
42.7 (5.9) |
32.0 (0.0) |
53.6 (12.0) |
| 平均低温 °F(°C) | 18.4 (−7.6) |
22.5 (−5.3) |
32.5 (0.3) |
43.1 (6.2) |
54.5 (12.5) |
63.9 (17.7) |
67.6 (19.8) |
65.3 (18.5) |
56.5 (13.6) |
44.5 (6.9) |
33.2 (0.7) |
23.4 (−4.8) |
43.8 (6.5) |
| 平均最低温 °F(°C) | −1.5 (−18.6) |
1.9 (−16.7) |
14.1 (−9.9) |
28.5 (−1.9) |
40.9 (4.9) |
53.5 (11.9) |
59.3 (15.2) |
55.1 (12.8) |
43.5 (6.4) |
28.5 (−1.9) |
16.4 (−8.7) |
5.3 (−14.8) |
−4.8 (−20.4) |
| 历史最低温 °F(°C) | −13 (−25) |
−13 (−25) |
−7 (−22) |
17 (−8) |
31 (−1) |
45 (7) |
52 (11) |
49 (9) |
32 (0) |
21 (−6) |
−2 (−19) |
−9 (−23) |
−13 (−25) |
| 平均降水量 英寸(mm) | 1.37 (35) |
1.77 (45) |
2.84 (72) |
4.24 (108) |
5.30 (135) |
4.88 (124) |
5.04 (128) |
3.94 (100) |
4.04 (103) |
3.16 (80) |
2.46 (62) |
1.83 (46) |
40.87 (1,038) |
| 平均降雪量 英寸(cm) | 4.8 (12) |
3.1 (7.9) |
1.4 (3.6) |
0.2 (0.51) |
0.0 (0.0) |
0.0 (0.0) |
0.0 (0.0) |
0.0 (0.0) |
0.0 (0.0) |
0.2 (0.51) |
1.0 (2.5) |
3.0 (7.6) |
13.7 (34.62) |
| 平均降水天数(≥ 0.01 in) | 7.3 | 6.9 | 10.0 | 10.9 | 12.0 | 10.1 | 9.2 | 9.1 | 8.3 | 9.1 | 7.2 | 7.5 | 107.6 |
| 平均降雪天数(≥ 0.1 in) | 2.8 | 1.9 | 0.9 | 0.2 | 0.0 | 0.0 | 0.0 | 0.0 | 0.0 | 0.2 | 0.4 | 2.1 | 8.5 |
| 数据来源1:NOAA[3] | |||||||||||||
| 数据来源2:National Weather Service (mean maxima/minima 2006–2020)[4] | |||||||||||||
人口
根據2020年美國人口普查的數據,希金斯維爾的面積為9.84平方千米,當中陸地面積為9.76平方千米,而水域面積為0.08平方千米。當地共有人口4817人,而人口密度為每平方千米490人。[1]
參考文獻
- ^ 1.0 1.1 2020 U.S. Gazetteer Files. United States Census Bureau. [2022-05-21].
- ^ Higginsville. 美国地质局地理名称信息系统.
- ^ U.S. Climate Normals Quick Access – Station: Higginsville, MO. National Oceanic and Atmospheric Administration. [2023-03-05].
- ^ NOAA Online Weather Data – NWS Pleasant Hill. National Weather Service. [2023-03-05].
| ||||||||||||||||||||||||||||||||||||||||
| 这是一篇密蘇里州的地理小作品。您可以通过编辑或修订扩充其内容。 |