Create custom metrics for Cloud SQL for PostgreSQL and AlloyDB using Logs Explorer
Svitlana Gavrylova
Data Management Practice Lead, UK/I
Indu Akkineni
Database Engineer, Cloud SQL
Google Cloud has several options for running PostgreSQL-compatible workloads including Cloud SQL for PostgreSQL, AlloyDB for PostgreSQL, and Spanner. To make sure that your databases are running optimally in a production environment, you need to monitor different aspects of their performance, for example, locking conditions, the number of appearances of particular errors in the database log. Additionally, a great way to take better care of your database health is by monitoring its error log for issues that may be affecting your users, such as deadlocks, job failures, and changes in database metric trends.
Logs Explorer is a Google Cloud tool that allows you to view and analyze logs from your Cloud SQL for PostgreSQL or AlloyDB instances. You can also use Logs Explorer to create custom metrics. In this blog, we present a couple of examples on how to do just that. Essentially, any entries pushed into postgres.log can be used to monitor and publish a new metric by using Logs Explorer. You can specify which exact condition/error from that log you want to track or be alerted on.
We also outline a set of steps that can guide you to use Log Explorer to create new custom metrics to enhance monitoring of your PostgreSQL database running on Cloud SQL or AlloyDB.
How to use Logs Explorer to create new metrics
First of all, let's determine what type of errors we want to monitor.
For our example database schema, we create a table with just one column as shown below:
Let’s generate errors during inserts into this table:
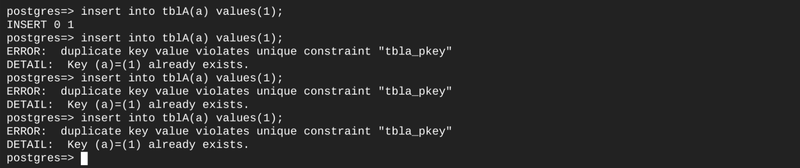
Monitoring unique key constraint violations can give you an early indication of an error in application logic or if something has changed in the upstream systems for the database.
Therefore, it will be beneficial to create a custom metric that displays the number of occurrences of “ERROR: duplicate key value violates unique constraint ...” over a certain period of time.
To create a new metric for duplicate key violations, follow these steps:
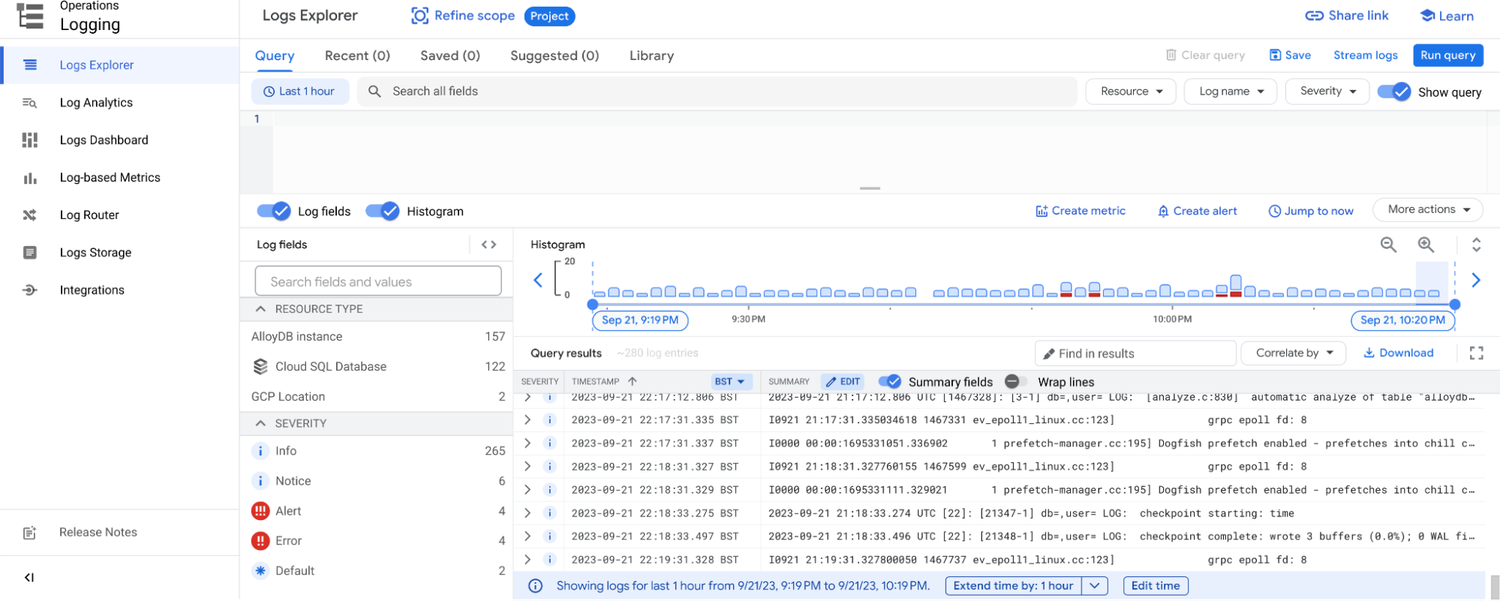
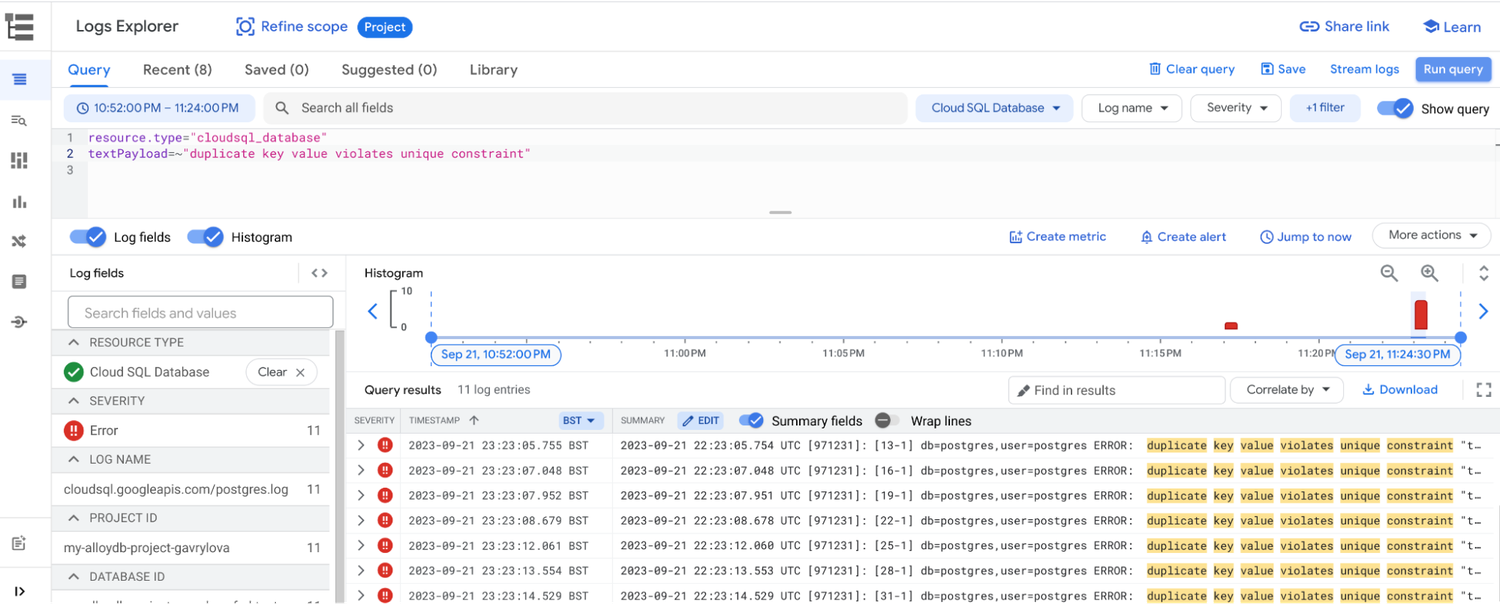
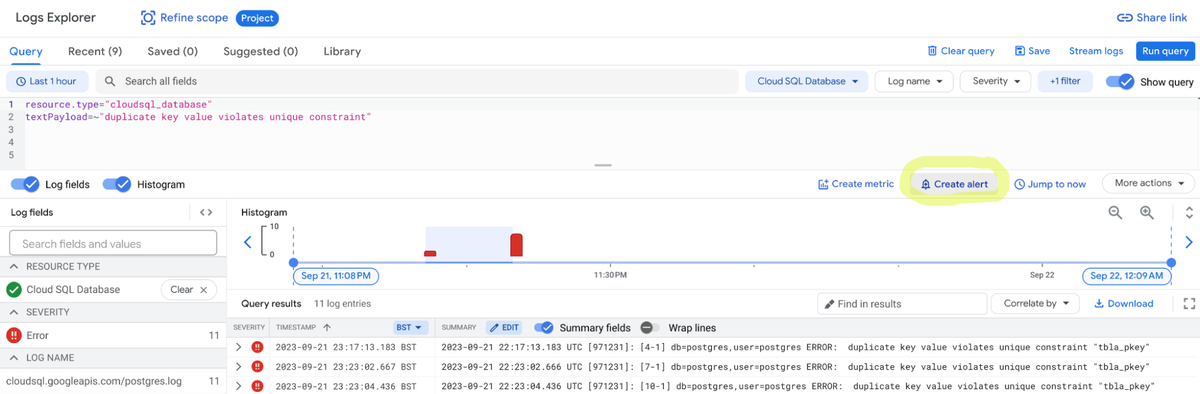
1. In the Google Cloud console, go to the Logs Explorer page. On the screen you could see following:
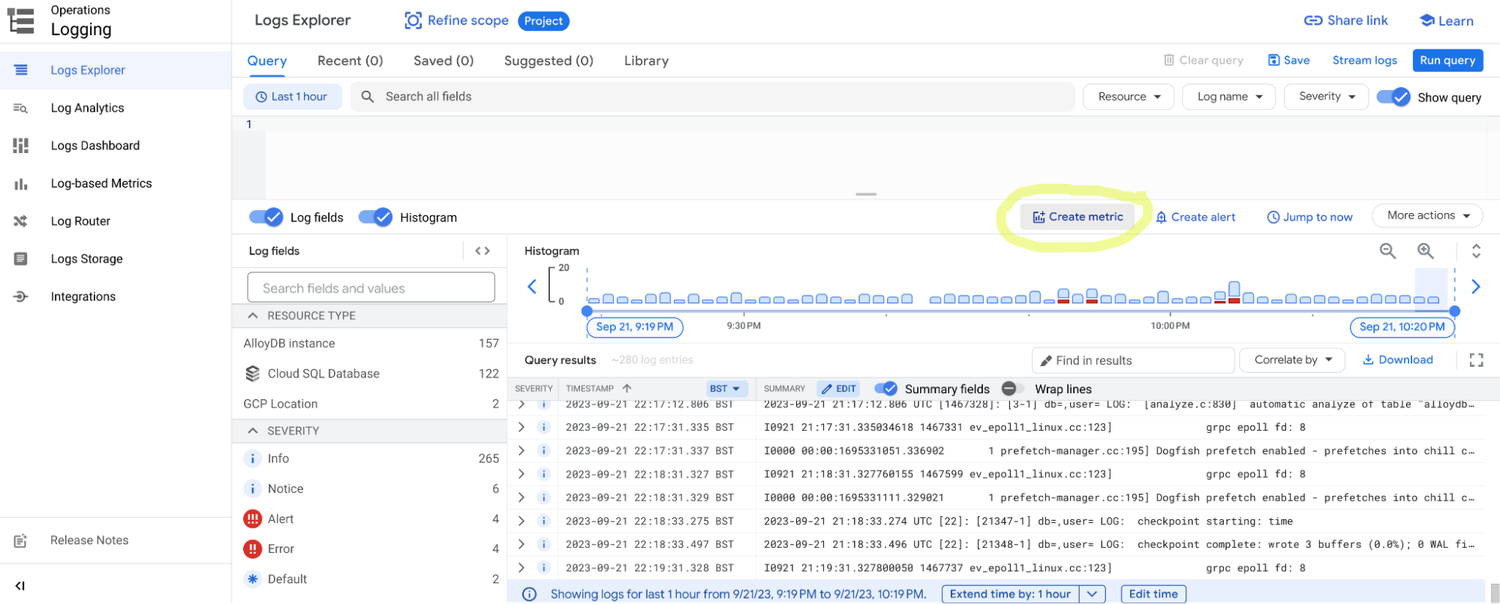
2. To create a new metric, click the Create Metric button.
3. Next, provide Metric Name, Metric Type to select the type of metric you want to create.
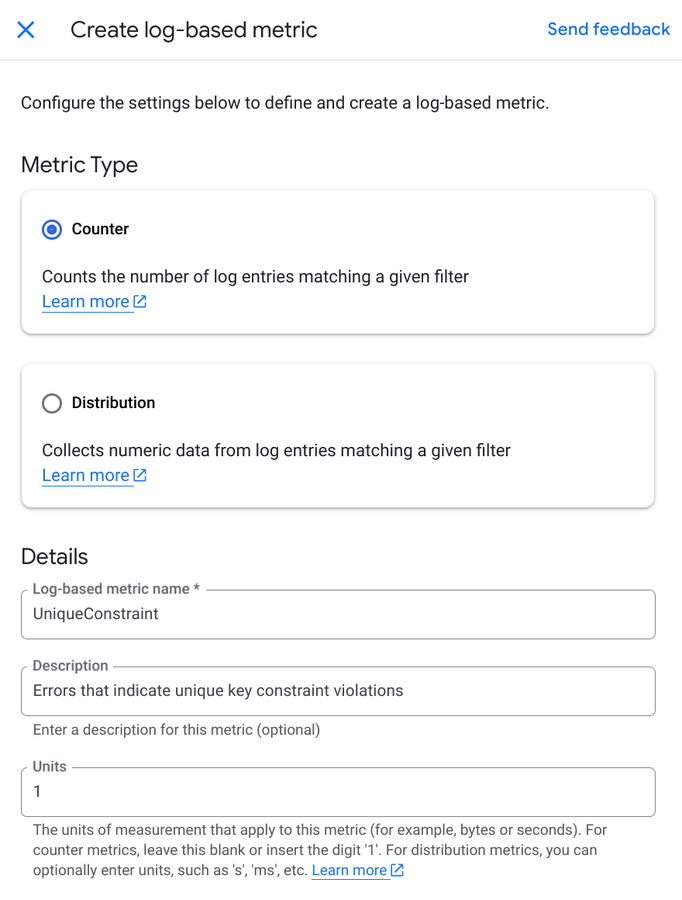
4. After this, you will need to input Metric Expression that defines the metric that you want to monitor in the CloudSQL or AlloyDB for PostgreSQL logs.
In our example, the expression could be the following:
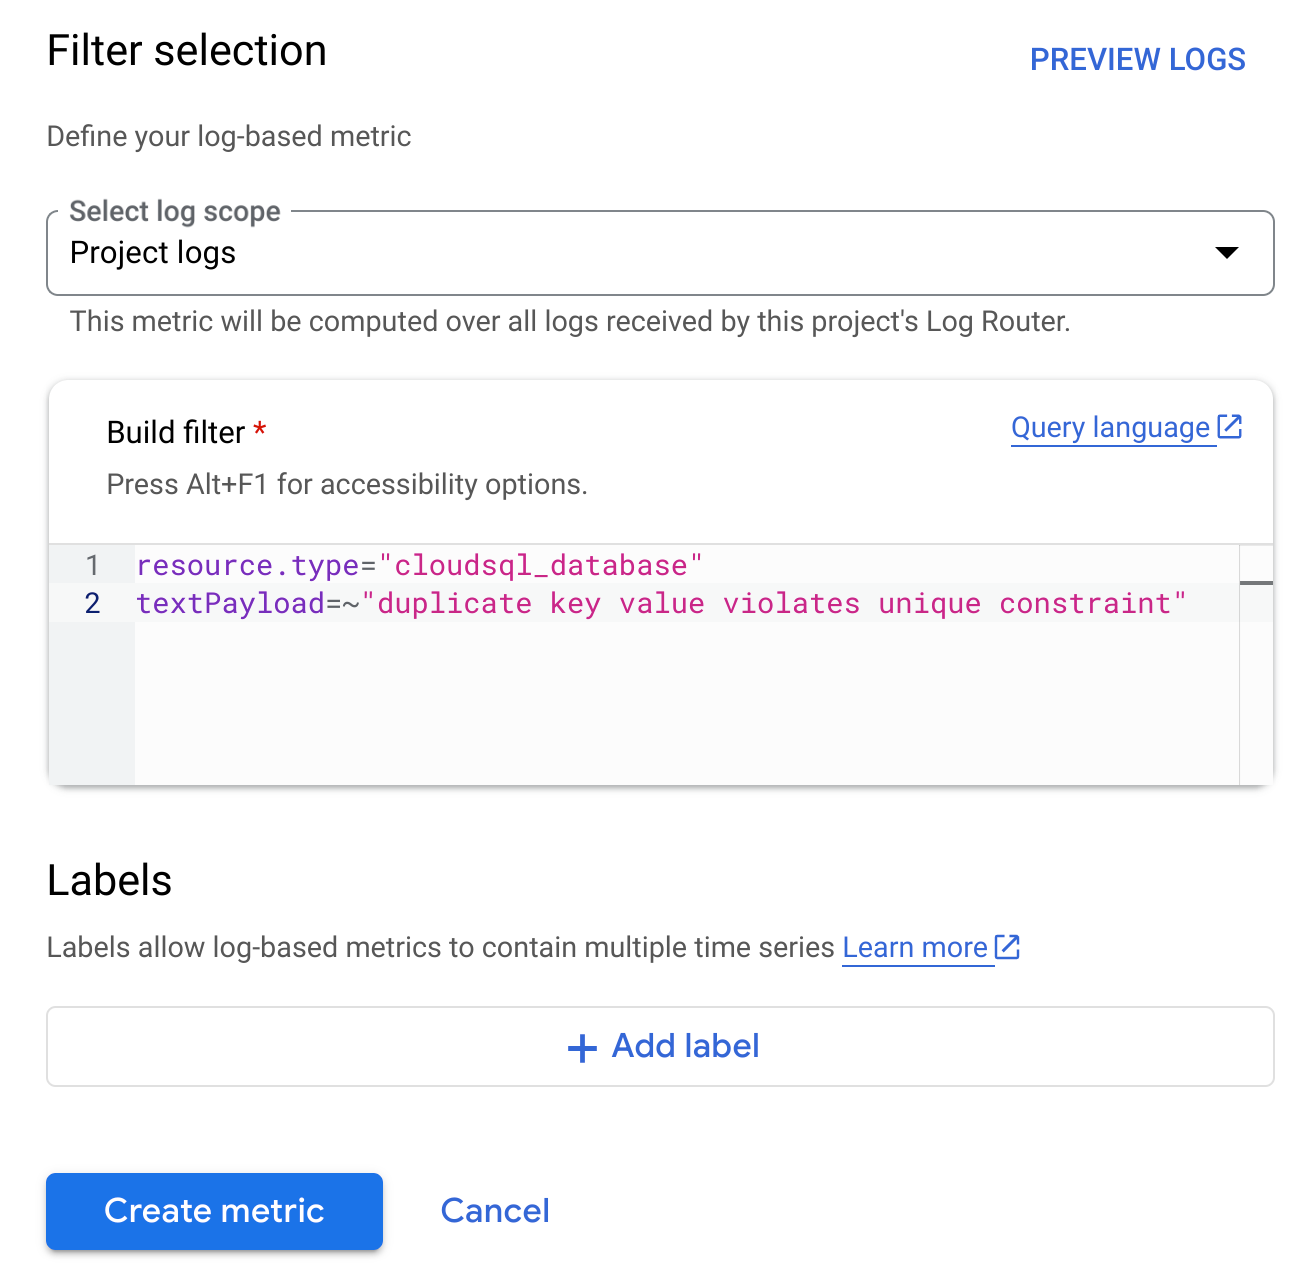
In order to make the filter more well-defined, you can use more precise filtering criteria, for example:
5. Finally, click the Create button to create your new metric. The new metric will be added to the list of metrics in Logs Explorer. You can then view and analyze the metric data using the tools in Logs Explorer and it will be listed on the ‘Log-based Metrics’ tab.

Congratulations! Your new log-based metric is now defined and ready to use. You can view logs for the created metrics in the Log Explorer as shown below:

For more information, you can refer to Cloud SQL Postgres documentation and Logs Explorer documentation.
In addition, you can find a list of the default pre-configured metrics that you can monitored for CloudSQL or AlloyDB for PostgreSQL instances here: https://cloud.google.com/sql/docs/postgres/admin-api/metrics and https://cloud.google.com/alloydb/docs/monitor-instance#metrics-pg.
The actual process of capturing this custom metric will involve several services provided by Google Cloud and is illustrated by the architecture below.
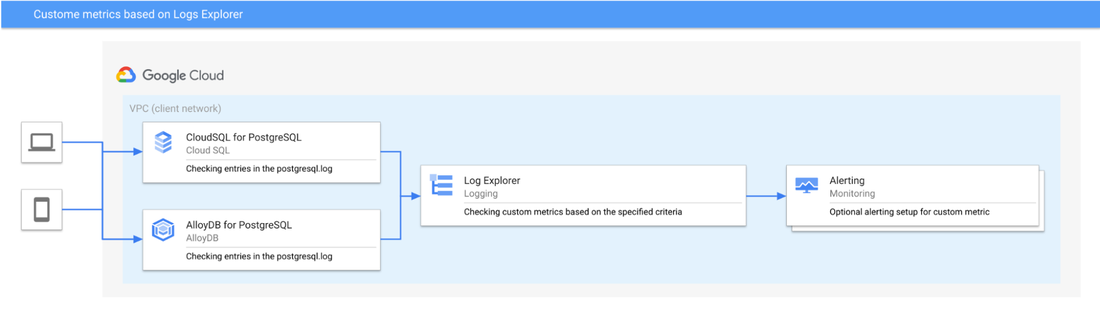
Figure. Custom metrics based on the Log Explorer
Now let's consider the sequence of actions that will be triggered when an error message in the format below appears in the postgres.log :
Once this error message appears in the errorlog of CouldSQL or AlloyDB for PostgreSQL, it is detected and injected into Google Cloud’s Logging system, after which, based on the specified filtering criteria and severity of the message, it is classified for display and aggregation into custom log-based metrics. Also, you can view the log entries of the CloudSQL for PostgreSQL instance itself by following the instructions outlined here.
Creating alerts based on log-based metrics
Based on log-based metrics, it is possible to create alerts via this process described here: https://cloud.google.com/logging/docs/logs-based-metrics/charts-and-alerts. Alternatively, from the Log Explorer tab, you can use button ‘Create alert’ to set up necessary alerting rules as shown below:
While creating the alert, you can specify which logs to include in the alerting, set the notification frequency and autoclose duration, as well as outline what channels to use for notification.
Custom log-based metrics use cases
Custom log-based metrics can be used for a variety of conditions. Here, we list several examples that give you an overview of most common scenarios when log-based metrics are beneficial for monitoring Cloud SQL or AlloyDB databases. Please note that PostgreSQL provides several mechanisms to set up more verbose logging for instances, and for some metrics more verbose logging will be advantageous.
Examples of ways to enable custom log-based metrics:
-
Monitoring long running queries: Enabling auto_explain.log_min_duration allows you to automatically log execution plans of long-running queries, along with the execution time for queries that run past the time threshold set. In conjunction with auto_explain.log_min_duration flags like auto_explain.log_nested_statements or auto_explain.log_level, we can enable log entries that can help record needed data in the logs for building custom log-based metrics.
-
Monitoring execution of VACUUM operations: To record details of VACUUM operation in the log, specify options like VERBOSE during execution. These details will include messages about which specific tables VACUUM is currently processing along with other statistics. Custom metrics can be built on these log entries to know how vacuum operations are performing. For AlloyDB, there is an adaptive autovacuum feature described here.
-
Monitoring data access related metrics: For CloudSQL and AlloyDB for PostgreSQL, you can enable the pgAudit extension, details of which can be found here. Additionally, you can set the flag pgaudit.log to enable and configure session logging. This flag can be enabled on an instance, a database, or a role level and it controls the scope and type of operations that pgAudit will log. In order to create a log-based metric for the messages logged by pgAudit, we need to use Log Explorer’s metric expression with a logName ‘data_access’. Here is an example
- Setting debug levels of Postgres to enable logging: Additionally, in a PostgreSQL database, you can use a RAISE statement to log application-specific messages and errors of different levels from SQL code, for example from stored procedures. The corresponding records with different levels (e.g. NOTICE) will appear in the Logs Explorer and you can set up a custom log-based metric based on those messages too. For example, a very simple stored procedure with a RAISE statement during fail insert operation can look like this:
To learn more about creating alerts and overview of tools available for the database monitoring, please visit https://cloud.google.com/alloydb/docs/monitor-instance and https://cloud.google.com/sql/docs/postgres/monitor-instance. You also can experiment with visualization of your custom log based metrics with Google Cloud monitoring dashboards: https://cloud.google.com/monitoring/dashboards#create_a_new_chart.