From Wikipedia, the free encyclopedia
Hi, I'm Steve Byrnes. Here is my personal website. Between 2005 and 2018 I was a prolific writer and editor of Wikipedia articles, mostly in physics, math, and engineering. I've been much less active since 2018, in order to free up more time for a different hobby (and later on, job) related to AGI safety.
Images I've made (in chronological order)
[edit]
-
The
exponential function ez can be defined as the
limit of (1+
z/N)
N, as N approaches infinity. Here, we take
z=iπ, and take N to be various increasing values from 1 to 100. The computation of (1+
iπ / N)
N is displayed as N repeated multiplications in the
complex plane, with the final point being the actual value of (1+
iπ / N)
N. As N gets larger, it can be seen that (1+
iπ / N)
N approaches a limit of -1. Therefore
eiπ=-1:
Euler's identity.
-
This is a similar illustration, but for
eiπ/3. For the article
Euler's formula.
-
A broad probability distribution on a log scale. The total area in blue and red are the relative probabilities that the first digit of a number drawn from this distribution starts with 8 and 1, respectively. This distribution follows Benford's law to a reasonably good accuracy: The ratio of the blue and red areas is nearly the same as the ratio of the blue and red widths.
-
A narrow probability distribution on a log scale. The total area in blue and red are the relative probabilities that the first digit of a number drawn from this distribution starts with 8 and 1, respectively. This distribution does not follow Benford's law: The ratio of the blue and red areas is very different from the ratio of blue and red widths.
-
A loop of wire (black), carrying a
current, creates a
magnetic field (blue). When the wire is
reflected in a mirror (dotted line), the magnetic field it generates is
not reflected in the mirror: Instead, it is reflected
and reversed. The position of the wire and its current are (polar) vectors, but the magnetic field is a pseudovector.
-
Diffusion from a microscopic and macroscopic point of view. Initially, there are
solute molecules on the left side of a barrier (purple line) and none on the right. The barrier is removed, and the solute diffuses to fill the whole container.
Top: A single molecule moves around randomly.
Middle: With more molecules, there is a clear trend where the solute fills the container more and more uniformly.
Bottom: With an enormous number of solute molecules, all randomness is gone: The solute appears to move smoothly and systematically from high-concentration areas to low-concentration areas, following
Fick's laws.
-
Simulation of many identical atoms undergoing
radioactive decay, starting with either 4 atoms (left) or 400 (right). The number at the top is how many half-lives have elapsed. Note the
Law of Large Numbers: With more atoms, the overall decay is less random.
-
Simulation illustrating the Law of Large Numbers. Each frame, you flip a coin that is red on one side and blue on the other, and put a dot in the corresponding column. A pie chart shows the proportion of red and blue so far. Notice that the proportion varies a lot at first, but gradually approaches 50%.
-
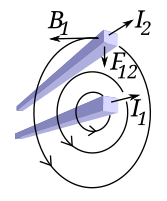
Two
current-carrying
wires can attract or repel each other magnetically, as described by
Ampère's force law. Here, the bottom wire has current
I1, which creates magnetic field
B1. The top wire carries a current
I2 through this magnetic field, so the wire experiences a
Lorentz force F
12. Simultaneously (not shown), the top wire makes a magnetic field which results in an
equal and opposite force on the bottom wire.
-
Angular frequency
ω (in radians per second), is larger than frequency
ν (in cycles per second, also called
Hz), by a factor of 2π.
-
Three flashing lights, from lowest frequency (top) to highest frequency (bottom). f is the frequency in
Hertz ("Hz"), meaning the number of flashes per second. T is the period in seconds ("s"), meaning the number of seconds per flash. T and f are
reciprocals.
-
The Shockley-Queisser limit for the maximum possible efficiency of a solar cell. (Under certain assumptions.)
-
The Shockley-Queisser limit for the maximum possible efficiency of a solar cell. (Under certain assumptions.) (Zoomed in near maximum-efficiency region.)
-
The Shockley-Queisser limit for the maximum possible short-circuit current density of a solar cell. (Under certain assumptions.)
-
Black curve: The Shockley-Queisser limit for the maximum possible open-circuit voltage of a solar cell. (Under certain assumptions.) Red dotted line is "y=x", showing that the open-circuit voltage is lower than the bandgap voltage.
-
A
homogeneous function is not necessarily
continuous, as shown by this example. This is the function
f defined by

if

or

if

. This function is homogeneous of order 1, i.e.

for any real numbers

. It is discontinuous at

.
-
A
harmonic oscillator in
classical mechanics (A-B) and
quantum mechanics (C-H). In (A-B), a ball, attached to a spring (gray line), oscillates back and forth. In (C-H),
wavefunction solutions to the
Time-Dependent Schrödinger Equation are shown for the same potential. The horizontal axis is position, the vertical axis is the real part (blue) or imaginary part (red) of the wavefunction. (C,D,E,F) are stationary states (energy eigenstates), which come from solutions to the
Time-Independent Schrödinger Equation. (G-H) are non-stationary states, solutions to the Time-Dependent but not Time-Independent Schrödinger Equation. (G) is a randomly-generated
quantum superposition of the four states (C-F). (H) is a "
coherent state" ("Glauber state") which somewhat resembles the classical state B.
-
Three wavefunction solutions to the Time-Dependent Schrödinger equation for a
harmonic oscillator. Left: The real part (blue) and imaginary part (red) of the wavefunction. Right: The probability of finding the particle at a certain position. The top two rows are two stationary states, and the bottom is the
superposition state 
, which is not a stationary state. The right column illustrates why stationary states are called "stationary".
-
Electron
wavefunctions for the
1s orbital of the hydrogen atom (left and right) and the corresponding bonding (bottom) and antibonding (top) molecular orbitals of the H
2 molecule. The
real part of the wavefunction is the blue curve, and the
imaginary part is the red curve. The red dots mark the locations of the protons. The electron wavefunction oscillates according to the
Schrödinger wave equation, and orbitals are the
standing waves. The standing wave frequency is proportional to the orbital's energy. (This plot is a one-dimensional slice through the three-dimensional system.)
-
It is impossible to make
magnetic monopoles from a
bar magnet. If a bar magnet is cut in half, it is
not the case that one half has the north pole and the other half has the south pole. Instead, each piece has its own north and south poles. A magnetic monopole cannot be created from normal matter such as
atoms and
electrons, but would instead be a new
elementary particle.
-
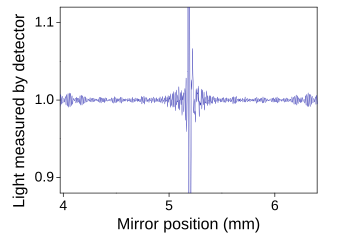
An FTIR interferogram. This is the "raw data" which can be
Fourier transformed into the FTIR spectrum. The peak at the center is the ZPD position ("Zero Path Difference"), where the two mirrors in the FTIR's
interferometer are equidistant from the
beamsplitter.
-
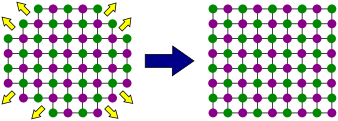
Why do crystals have smooth, flat faces? As a
halite crystal is growing, new atoms can very easily attach to the parts of the surface with rough atomic-scale structure and many
dangling bonds. Therefore these parts of the crystal grow out very quickly (orange arrows). Eventually, the whole surface consists of smooth,
stable faces, where new atoms cannot as easily attach themselves. (After
this webpage.)
-
Microscopically, a
single crystal has atoms in a near-perfect
periodic arrangement; a
polycrystal is composed of many microscopic crystals (called "
crystallites" or "grains"); and an
amorphous solid (such as
glass) has no periodic arrangement even microscopically. (Adapted from
this image.)
-
Relationship between the (continuous)
Fourier transform and the discrete Fourier transform.
Left column: A continuous function (top) and its Fourier transform (bottom).
Center-left column: If the function is periodically repeated, its Fourier transform becomes zero except at discrete points.
Center-right column: Conversely, if the function is discretized (multiplied by a
Dirac comb), its Fourier transform becomes periodic.
Right column: If a function is both discrete and periodic, then so is its Fourier transform. The situation in the right column is mathematically identical to the discrete Fourier transform.
-
Example of how the
polarization density in a bulk crystal is ambiguous. (a) A solid crystal. (b) By pairing the positive and negative charges in a certain way, the crystal appears to have an upward polarization. (c) By pairing the charges differently, the crystal appears to have a downward polarization.
-
The
hydraulic analogy compares electric current flowing through circuits to water flowing through pipes. When a pipe (left) is filled with hair (right), it takes a larger pressure to achieve the same flow of water. Pushing electric current through a large resistance is like pushing water through a pipe clogged with hair: It requires a larger voltage drop to drive the same current.
-
-
The
IV curve of a non-ohmic device (purple). Point A represents the current and voltage right now. The
chordal resistance (
static resistance) is the
inverse slope of line B through the origin. The
differential resistance is the inverse slope of
tangent line C.
-
In the
hydraulic analogy, a capacitor is analogous to a rubber membrane sealed inside a pipe. This animation illustrates a membrane being repeatedly stretched and un-stretched by the flow of water, which is analogous to a capacitor being repeatedly charged and discharged by the flow of current.
-
The different types of
rotation operators.
Top: Two particles, with
spin states indicated schematically by the arrows.
(A) The operator
R, related to
J, rotates the entire system.
(B) The operator
Rspatial, related to
L, rotates the particle positions without altering their internal
spin states.
(C) The operator
Rinternal, related to
S, rotates the particles' internal spin states without changing their positions.
-
Schematic showing how a wave flows down a lossless
transmission line. Black dots represent electrons, and the arrows show the electric field.
-
Transmission lines terminated by an open circuit (top) and a short circuit (bottom). A pulse reflects perfectly off both these terminations, but with opposite sign of the reflected voltage. Black dots represent electrons, and arrows show the electric field.
-
A
transmission line is drawn as two black wires. At a distance
x into the line, there is current
phasor I(x) traveling through each wire, and there is a
voltage difference phasor
V(x) between the wires (bottom voltage minus top voltage). If

is the
characteristic impedance of the line, then

for a wave moving rightward, or

for a wave moving leftward.
-
Most basic use of an impedance Smith chart. A wave travels down a
transmission line of
characteristic impedance Z0, terminated at a load with
impedance ZL and normalised impedance
z=ZL/Z0. There is a
signal reflection with coefficient Γ. Each point on the Smith chart simultaneously represents both a value of
z (bottom left), and the corresponding value of Γ (bottom right), related by
z=(1+Γ)/(1-Γ).
-
Looking towards a load through a length
l of lossless transmission line, the impedance changes as
l increases, following the blue circle. (This impedance is characterized by its reflection coefficient
Vreflected / Vincident.) The blue circle, centered within the impedance Smith chart, is sometimes called an
SWR circle (short for
constant standing wave ratio).
-
A schematic of an
ionic crystal with no applied
electric field (top), and with a sinusoidal electric field caused by a light wave (bottom). The blurryness indicates the sinusoidal oscillation of the ions. The red arrow indicates
optical rectification: The oscillating electric field causes a shift of the ions' average positions, which in turn changes the crystal's DC
polarization.
-
These three circuits are all equivalent:
(A) A resistor at nonzero temperature, which has Johnson noise;
(B) A noiseless resistor
in series with a noise-creating voltage source (i.e. the
Thévenin equivalent circuit);
(C) A a noiseless resistance
in parallel with a noise-creating current source (i.e. the
Norton equivalent circuit).
-
A
Bloch wave (bottom) can be broken up into the product of a periodic function (top) and a plane-wave (center). The left side and right side represent the same Bloch wave broken up in two different ways, involving the wave vector
k1 (left) or
k2 (right). The difference (
k1−
k2) is a
reciprocal lattice vector. In all plots, blue is real part and red is imaginary part.
-
The
electric field (E-field) of a
surface plasmon polariton (SPP) at the silver-air interface, at the frequency where the free-space wavelength is 370nm. The animation shows how the E-field varies over an optical cycle. The
permittivity of silver at this frequency is
(-2.6 + 0.6i). The picture is
(0.3 × 370nm) across horizontally; the SPP wavelength is much smaller than the free-space wavelength.
-
The E-field of an SPP at the silver-air interface, at a much lower frequency corresponding to a free-space wavelength of 10μm. At this frequency, the silver behaves approximately as a
perfect electric conductor, and the SPP is called a
Sommerfeld Zenneck wave, with almost the same wavelength as the free-space wavelength. The permittivity of silver at this frequency is
(-2700 + 1400i). The picture is
(0.6 × 10μm) across horizontally.
-
An example of a simple system that would exhibit the
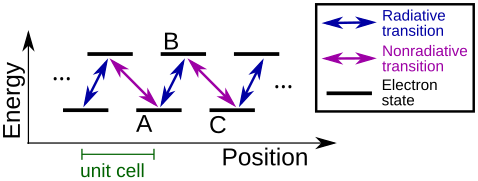
bulk photovoltaic effect. There are two electronic levels per unit cell, separated by a large energy gap, say 3eV. The blue arrows indicate radiative transitions, i.e. an electron can absorb a UV photon to go from A to B, or it can emit a UV photon to go from B to A. The purple arrows indicate nonradiative transitions, i.e. an electron can go from B to C by emitting many phonons, or can go from C to B by absorbing many phonons. When light is shining, an electron will occasionally move right by absorbing a photon and going from A to B to C. However, it will almost never move in the reverse direction, C to B to A, because the transition from C to B requires an improbably large thermal fluctuation. Therefore, there is a net rightward photocurrent.
-
In the 2D plane, pick a fixed point a distance ν from the origin. Generate a distribution of 2D points centered around that point, where the x and y coordinates are chosen independently from a
gaussian distribution with standard deviation σ (blue region). If R is the distance from these points to the origin, then R has a Rice distribution.
-
A clock is most easily tested by comparing it with a far more accurate reference clock. During an interval of time τ, as measured by the reference clock, the clock under test advances by τy, where y is the (relative) clock frequency over that interval. If we take three consecutive clock measurements as shown, we can get a value of (y-y')2—a smaller value indicates a more stable and precise clock. If we repeat this procedure many times, the average value of (y-y')2 is equal to the Allan variance (or Allan deviation squared) for observation time τ.
-
In ray transfer (ABCD) matrix analysis, an optical element (here, a thick lens) gives a transformation between

at the input plane and

when the ray arrives at the output plane.
-

is the counterclockwise angle of the point (x,y) from the positive x-axis—i.e., points counterclockwise of the +x-axis have positive angle, and points clockwise of the +x-axis have negative angle. Equivalently,
is the
argument (also called
phase or
angle) of the
complex number 
.
Conceptual explanations
[edit]A few of the conceptual / qualitative (or only slightly quantitative!) explanations that I've written for physics and math articles:
| RSI | This user made a miraculous recovery from RSI using the treatment method of John Sarno. |
|
 | Content contributed by this user is released into the public domain. |
|

|
Released into public domain
|
|
| I agree to release my text and image contributions, unless otherwise stated, into the public domain. Please be aware that other contributors might not do the same, so if you want to use my contributions under public domain terms, please check the multi-licensing guide.
|
Please keep in mind: My text and images for Wikipedia are public domain (when possible). If you use them without giving any credit or attribution or link to their author (me) and/or source (wikipedia), you are not behaving illegally...but you are behaving unethically!

 The exponential function ez can be defined as the limit of (1+z/N)N, as N approaches infinity. Here, we take z=iπ, and take N to be various increasing values from 1 to 100. The computation of (1+iπ / N)N is displayed as N repeated multiplications in the complex plane, with the final point being the actual value of (1+iπ / N)N. As N gets larger, it can be seen that (1+iπ / N)N approaches a limit of -1. Therefore eiπ=-1: Euler's identity.
 This is a similar illustration, but for eiπ/3. For the article Euler's formula.

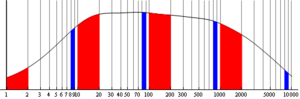 A broad probability distribution on a log scale. The total area in blue and red are the relative probabilities that the first digit of a number drawn from this distribution starts with 8 and 1, respectively. This distribution follows Benford's law to a reasonably good accuracy: The ratio of the blue and red areas is nearly the same as the ratio of the blue and red widths.
 A narrow probability distribution on a log scale. The total area in blue and red are the relative probabilities that the first digit of a number drawn from this distribution starts with 8 and 1, respectively. This distribution does not follow Benford's law: The ratio of the blue and red areas is very different from the ratio of blue and red widths.

 A loop of wire (black), carrying a current, creates a magnetic field (blue). When the wire is reflected in a mirror (dotted line), the magnetic field it generates is not reflected in the mirror: Instead, it is reflected and reversed. The position of the wire and its current are (polar) vectors, but the magnetic field is a pseudovector.
 Diffusion from a microscopic and macroscopic point of view. Initially, there are solute molecules on the left side of a barrier (purple line) and none on the right. The barrier is removed, and the solute diffuses to fill the whole container. Top: A single molecule moves around randomly. Middle: With more molecules, there is a clear trend where the solute fills the container more and more uniformly. Bottom: With an enormous number of solute molecules, all randomness is gone: The solute appears to move smoothly and systematically from high-concentration areas to low-concentration areas, following Fick's laws.
 Simulation of many identical atoms undergoing radioactive decay, starting with either 4 atoms (left) or 400 (right). The number at the top is how many half-lives have elapsed. Note the Law of Large Numbers: With more atoms, the overall decay is less random.
 Simulation illustrating the Law of Large Numbers. Each frame, you flip a coin that is red on one side and blue on the other, and put a dot in the corresponding column. A pie chart shows the proportion of red and blue so far. Notice that the proportion varies a lot at first, but gradually approaches 50%.
 Two current-carrying wires can attract or repel each other magnetically, as described by Ampère's force law. Here, the bottom wire has current I1, which creates magnetic field B1. The top wire carries a current I2 through this magnetic field, so the wire experiences a Lorentz force F12. Simultaneously (not shown), the top wire makes a magnetic field which results in an equal and opposite force on the bottom wire.
 A diatomic molecule undergoing libration.

 Three flashing lights, from lowest frequency (top) to highest frequency (bottom). f is the frequency in Hertz ("Hz"), meaning the number of flashes per second. T is the period in seconds ("s"), meaning the number of seconds per flash. T and f are reciprocals.
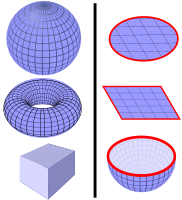 Some examples of closed surfaces (left) and surfaces with boundaries (right). Left: Surface of a sphere, surface of a torus, surface of a cube. Right: Disk surface, square surface, surface of a hemisphere. (The surface is blue, the boundary is red.) The surfaces on the left can be used in Gauss's law for magnetism, the surfaces on the right can be used in Faraday's law of induction.
 The Shockley-Queisser limit for the maximum possible efficiency of a solar cell. (Under certain assumptions.)
 The Shockley-Queisser limit for the maximum possible efficiency of a solar cell. (Under certain assumptions.) (Zoomed in near maximum-efficiency region.)
 The Shockley-Queisser limit for the maximum possible short-circuit current density of a solar cell. (Under certain assumptions.)
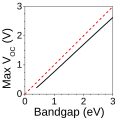 Black curve: The Shockley-Queisser limit for the maximum possible open-circuit voltage of a solar cell. (Under certain assumptions.) Red dotted line is "y=x", showing that the open-circuit voltage is lower than the bandgap voltage.


 Breakdown of the causes for the Shockley-Queisser limit. The black height is energy that can be extracted as useful electrical power (the Shockley-Queisser efficiency limit); the pink height is energy of below-bandgap photons; the green height is energy lost when hot photogenerated electrons and holes relax to the band edges; the blue height is energy lost in the tradeoff between low radiative recombination versus high operating voltage.
 A homogeneous function is not necessarily continuous, as shown by this example. This is the function f defined by if or if . This function is homogeneous of order 1, i.e. for any real numbers . It is discontinuous at .
 A harmonic oscillator in classical mechanics (A-B) and quantum mechanics (C-H). In (A-B), a ball, attached to a spring (gray line), oscillates back and forth. In (C-H), wavefunction solutions to the Time-Dependent Schrödinger Equation are shown for the same potential. The horizontal axis is position, the vertical axis is the real part (blue) or imaginary part (red) of the wavefunction. (C,D,E,F) are stationary states (energy eigenstates), which come from solutions to the Time-Independent Schrödinger Equation. (G-H) are non-stationary states, solutions to the Time-Dependent but not Time-Independent Schrödinger Equation. (G) is a randomly-generated quantum superposition of the four states (C-F). (H) is a "coherent state" ("Glauber state") which somewhat resembles the classical state B.
 Basically the same as the one above, but this one is an infinite square well potential (also called particle in a box).
 Three wavefunction solutions to the Time-Dependent Schrödinger equation for a harmonic oscillator. Left: The real part (blue) and imaginary part (red) of the wavefunction. Right: The probability of finding the particle at a certain position. The top two rows are two stationary states, and the bottom is the superposition state , which is not a stationary state. The right column illustrates why stationary states are called "stationary".
 Electron wavefunctions for the 1s orbital of the hydrogen atom (left and right) and the corresponding bonding (bottom) and antibonding (top) molecular orbitals of the H2 molecule. The real part of the wavefunction is the blue curve, and the imaginary part is the red curve. The red dots mark the locations of the protons. The electron wavefunction oscillates according to the Schrödinger wave equation, and orbitals are the standing waves. The standing wave frequency is proportional to the orbital's energy. (This plot is a one-dimensional slice through the three-dimensional system.)
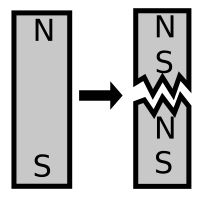 It is impossible to make magnetic monopoles from a bar magnet. If a bar magnet is cut in half, it is not the case that one half has the north pole and the other half has the south pole. Instead, each piece has its own north and south poles. A magnetic monopole cannot be created from normal matter such as atoms and electrons, but would instead be a new elementary particle.
 An FTIR interferogram. This is the "raw data" which can be Fourier transformed into the FTIR spectrum. The peak at the center is the ZPD position ("Zero Path Difference"), where the two mirrors in the FTIR's interferometer are equidistant from the beamsplitter.
 Why do crystals have smooth, flat faces? As a halite crystal is growing, new atoms can very easily attach to the parts of the surface with rough atomic-scale structure and many dangling bonds. Therefore these parts of the crystal grow out very quickly (orange arrows). Eventually, the whole surface consists of smooth, stable faces, where new atoms cannot as easily attach themselves. (After this webpage.)
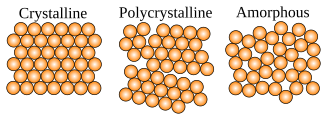 Microscopically, a single crystal has atoms in a near-perfect periodic arrangement; a polycrystal is composed of many microscopic crystals (called "crystallites" or "grains"); and an amorphous solid (such as glass) has no periodic arrangement even microscopically. (Adapted from this image.)

 Relationship between the (continuous) Fourier transform and the discrete Fourier transform. Left column: A continuous function (top) and its Fourier transform (bottom). Center-left column: If the function is periodically repeated, its Fourier transform becomes zero except at discrete points. Center-right column: Conversely, if the function is discretized (multiplied by a Dirac comb), its Fourier transform becomes periodic. Right column: If a function is both discrete and periodic, then so is its Fourier transform. The situation in the right column is mathematically identical to the discrete Fourier transform.
 Example of how the polarization density in a bulk crystal is ambiguous. (a) A solid crystal. (b) By pairing the positive and negative charges in a certain way, the crystal appears to have an upward polarization. (c) By pairing the charges differently, the crystal appears to have a downward polarization.
 The hydraulic analogy compares electric current flowing through circuits to water flowing through pipes. When a pipe (left) is filled with hair (right), it takes a larger pressure to achieve the same flow of water. Pushing electric current through a large resistance is like pushing water through a pipe clogged with hair: It requires a larger voltage drop to drive the same current.
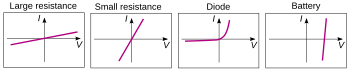 The current-voltage characteristics of four devices: Two resistors, a diode, and a battery. (The battery has nonzero internal resistance.)

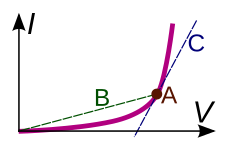 The IV curve of a non-ohmic device (purple). Point A represents the current and voltage right now. The chordal resistance (static resistance) is the inverse slope of line B through the origin. The differential resistance is the inverse slope of tangent line C.
 In the hydraulic analogy, a capacitor is analogous to a rubber membrane sealed inside a pipe. This animation illustrates a membrane being repeatedly stretched and un-stretched by the flow of water, which is analogous to a capacitor being repeatedly charged and discharged by the flow of current.
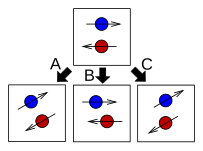 The different types of rotation operators. Top: Two particles, with spin states indicated schematically by the arrows. (A) The operator R, related to J, rotates the entire system. (B) The operator Rspatial, related to L, rotates the particle positions without altering their internal spin states. (C) The operator Rinternal, related to S, rotates the particles' internal spin states without changing their positions.
 Schematic showing how a wave flows down a lossless transmission line. Black dots represent electrons, and the arrows show the electric field.
 Standing waves on a transmission line with an open-circuit load (top), and a short-circuit load (bottom). Black dots represent electrons, and the arrows show the electric field.
 Transmission lines terminated by an open circuit (top) and a short circuit (bottom). A pulse reflects perfectly off both these terminations, but with opposite sign of the reflected voltage. Black dots represent electrons, and arrows show the electric field.
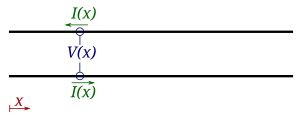 A transmission line is drawn as two black wires. At a distance x into the line, there is current phasor I(x) traveling through each wire, and there is a voltage difference phasor V(x) between the wires (bottom voltage minus top voltage). If is the characteristic impedance of the line, then for a wave moving rightward, or for a wave moving leftward.
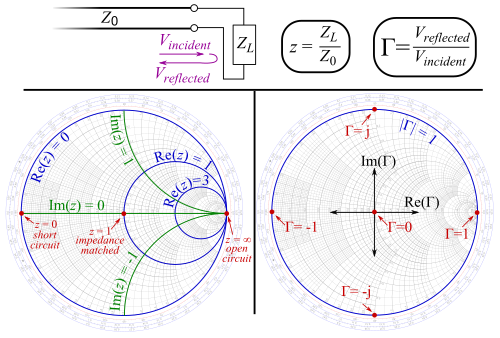 Most basic use of an impedance Smith chart. A wave travels down a transmission line of characteristic impedance Z0, terminated at a load with impedance ZL and normalised impedance z=ZL/Z0. There is a signal reflection with coefficient Γ. Each point on the Smith chart simultaneously represents both a value of z (bottom left), and the corresponding value of Γ (bottom right), related by z=(1+Γ)/(1-Γ).
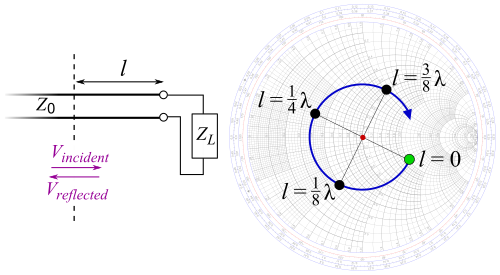 Looking towards a load through a length l of lossless transmission line, the impedance changes as l increases, following the blue circle. (This impedance is characterized by its reflection coefficient Vreflected / Vincident.) The blue circle, centered within the impedance Smith chart, is sometimes called an SWR circle (short for constant standing wave ratio).
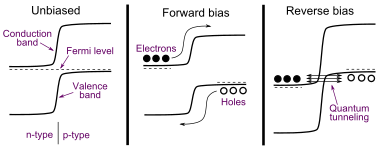 Band diagram of a backward diode. Electron energy is on the vertical axis, position within the device is on the horizontal axis. The backward diode has the unusual property that the so-called reverse bias direction actually has more current flow than the so-called forward bias.
 A schematic of an ionic crystal with no applied electric field (top), and with a sinusoidal electric field caused by a light wave (bottom). The blurryness indicates the sinusoidal oscillation of the ions. The red arrow indicates optical rectification: The oscillating electric field causes a shift of the ions' average positions, which in turn changes the crystal's DC polarization.
 These three circuits are all equivalent: (A) A resistor at nonzero temperature, which has Johnson noise; (B) A noiseless resistor in series with a noise-creating voltage source (i.e. the Thévenin equivalent circuit); (C) A a noiseless resistance in parallel with a noise-creating current source (i.e. the Norton equivalent circuit).
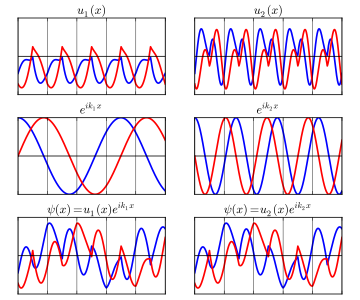 A Bloch wave (bottom) can be broken up into the product of a periodic function (top) and a plane-wave (center). The left side and right side represent the same Bloch wave broken up in two different ways, involving the wave vector k1 (left) or k2 (right). The difference (k1−k2) is a reciprocal lattice vector. In all plots, blue is real part and red is imaginary part.
 The electric field (E-field) of a surface plasmon polariton (SPP) at the silver-air interface, at the frequency where the free-space wavelength is 370nm. The animation shows how the E-field varies over an optical cycle. The permittivity of silver at this frequency is (-2.6 + 0.6i). The picture is (0.3 × 370nm) across horizontally; the SPP wavelength is much smaller than the free-space wavelength.
 The E-field of an SPP at the silver-air interface, at a much lower frequency corresponding to a free-space wavelength of 10μm. At this frequency, the silver behaves approximately as a perfect electric conductor, and the SPP is called a Sommerfeld Zenneck wave, with almost the same wavelength as the free-space wavelength. The permittivity of silver at this frequency is (-2700 + 1400i). The picture is (0.6 × 10μm) across horizontally.

 An example of a simple system that would exhibit the bulk photovoltaic effect. There are two electronic levels per unit cell, separated by a large energy gap, say 3eV. The blue arrows indicate radiative transitions, i.e. an electron can absorb a UV photon to go from A to B, or it can emit a UV photon to go from B to A. The purple arrows indicate nonradiative transitions, i.e. an electron can go from B to C by emitting many phonons, or can go from C to B by absorbing many phonons. When light is shining, an electron will occasionally move right by absorbing a photon and going from A to B to C. However, it will almost never move in the reverse direction, C to B to A, because the transition from C to B requires an improbably large thermal fluctuation. Therefore, there is a net rightward photocurrent.
 An electron (purple) is being pushed side-to-side by a sinusoidally-oscillating force, e.g. the electric field of a light wave. But because the electron is in an anharmonic potential (black curve), the electron motion is not sinusoidal. The three arrows show the Fourier series of the motion: The blue arrow corresponds to ordinary (linear) susceptibility, the green arrow corresponds to second-harmonic generation, and the red arrow corresponds to optical rectification.
 The six arrows represent the first six terms of the Fourier series of a square wave. The two circles at the bottom represent the exact square wave (blue) and its Fourier-series approximation (purple).
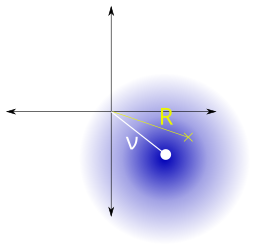 In the 2D plane, pick a fixed point a distance ν from the origin. Generate a distribution of 2D points centered around that point, where the x and y coordinates are chosen independently from a gaussian distribution with standard deviation σ (blue region). If R is the distance from these points to the origin, then R has a Rice distribution.
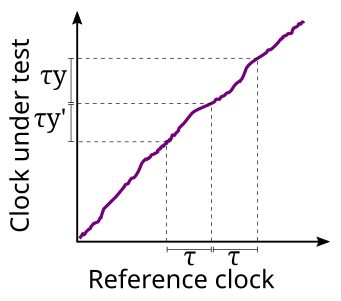 A clock is most easily tested by comparing it with a far more accurate reference clock. During an interval of time τ, as measured by the reference clock, the clock under test advances by τy, where y is the (relative) clock frequency over that interval. If we take three consecutive clock measurements as shown, we can get a value of (y-y')2—a smaller value indicates a more stable and precise clock. If we repeat this procedure many times, the average value of (y-y')2 is equal to the Allan variance (or Allan deviation squared) for observation time τ.
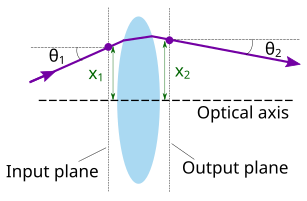 In ray transfer (ABCD) matrix analysis, an optical element (here, a thick lens) gives a transformation between at the input plane and when the ray arrives at the output plane.
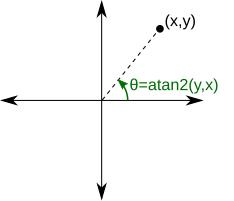 is the counterclockwise angle of the point (x,y) from the positive x-axis—i.e., points counterclockwise of the +x-axis have positive angle, and points clockwise of the +x-axis have negative angle. Equivalently, is the argument (also called phase or angle) of the complex number .